Notes from Dec. 18th eMeeting
Initially, Randy and Chad
=======================
Collaboration:
Notebooks, of course
Shared notebook
Possible -- Moodle as peer review site?
Wiki page for posting and creation of "publications"
Three tools:
Dragons -- QTL creation functionality
GBrowse --
Integration --
Content for Gbrowse dragon
Deciding on tracks
Developing scaffolded methodology
(More info about what exists for dragon genomics)
Mouse piece
4 publications with literature -- do QTL studies on data -- compare
Give 8 with literature
Pared-down mouse data
Haplotype mapping to
Knockouts to isolate if gene is correct
Complex traits exist within mouse realm
Gene networks -- how interacting
May 2008 -- functioning version of jQTL
Will be capable of complete QTL analysis including fit model
Will be in Java
End up with complete script
Reproducible research within jQTL -- script save
Stephen and Paul enter
========================
Questions about integration of jQTL
When to start integration with OTrunk
What affordances we want to get --
R scripts and collect output
Visualizations -- view and control
modification of scripts more accurately
Randy:
release date of May 2008 --
suggest start with R script?
New version allows you to do QTL analysis with GUI interface
Don't need script, but writes script as history of student work
Timeline? Wouldn't plan on integrating until May or June
Stephen:
Inflection points earlier -- if we know features ahead of time,
Can help collect data more easily about process students use
If practical, even without all features or half features, would be
useful to have code to integrate sooner rather than later -- gives
Concord useful data and could help programmers as well
Randy:
Right now, not stable enough to practically use for anything,
but Feb. or Mar. would be useful to spend day?
Stephen:
Can it take R script and get back data?
[Clarification of scripts -- jQTL takes inputs from interface and creates scripts, then output from R comes back and is visualized by jQTL]
Paul:
Relation of genotypic info to phenotypic info should be understood by students -- make sure they understand what's going on here -- could you do this by eye with a simple system?
Randy:
Yes -- example with blood pressure -- pointing to a region on chromosome that is interesting
Stephen:
Basic dragon scenarios --
Diet difference -- some getting sick, some not (some adapt better to stress)
Geographical distribution to stress -- industrial pollution in groundwater or river?
Interested in two things: Why getting sick and also how affecting people? Also lead to understanding of biology, etc.
Randy:
Dragon breeders -- bring dragons together -- food blend problem b/c some getting sick
Stephen: questions on how R and RQTL are integrated? Could work on integrating R with ...?
Randy: JRI (Java-R interface) is interface package
Jaguar -- Java wrapper on R language -- uses language to directly speak between Java and R -- uses R dll library directly, enables you to pass commands to R, R processes commands and it returns them -- you do what you want with the returned info. Keith is the man for this -- you should probably talk to him at that point. Randy will send links to Stephen for this.
Stephen: Of stuff sent before -- Note what is private and shouldn't be put on wiki page?
Randy: all of it on grants -- cutting-edge science is only issue, but we're not there
Also -- meeting on 14th
Paul: concern - most students won't get this -- is there a phase zero?
Chad/Randy: Will plan to have this in some way - Also, problem that comes will have students go to literature? To show ways others have solved these problems; introduce to ideas of markers, etc? Use this information to write a proposal to explain how they look for this -- (Chad: Maybe do this in the mouse part, instead of the dragon part?)
Paul: Do have ability to go beyond this -- can do this other ways with Biologica. What needs to change in Biologica to enable this? Need to know this soon. Need database of more than 9 genes -- and clinical trait examples -- not obvious examples. Way of introducing these clinical traits
Markers in non-coding regions also need to be built into this model
Create spec for this --
Start with pedagogy -- come at this with full desired model, etc. and then look at resources and what we can do
Stephen: Biologica work and integrating and extending / simple QTL portion has gotten larger and seems appropriate -- proposals and resources and edge of collaboration, combining datasets seems difficult, or definitely new work. Integration with R doesn't sound hard. Not sure when to integrate with new version of JQTL, but not anticipated to be too hard. Get enough to hm
Meeting on 14th -- would like concrete ideas of how each of these parts
Scenario 0/1/1.5 -- WHat do we think we need as affordances to topic, what level of QTL analysis will they be doing with dragons? How open-ended will this be for students? Can start sharing dynamic artifacts.
Having a clear outline of elements for scenarios 0.0-1.5
Wherever elements can be live and active would be nice
Be able to say "here is the QTL analysis part"
How big is dragon genome?
Paul:
Coordination between two meetings
Jean Moon meeting -- context coming up
...vs. GQ meeting
-At a level too difficult for kids. Need very simple example that captures the essence of what people are doing. With plots, etc. students need to understand relationship between what graphs are showing and the genetics is important. Keeping simple ideas at the fore is important.
Simple idea -- two markers,
How does this look as an activity -- kid can stop meiosis and create recombination -- create strains with one marker, with both markers, with all, etc. Kid understands then what these mean -- turns out there is a gene and...
Really hard part in this business is thinking at multiple levels -- phenotypic info, marker info and gene info connected in some way
Paul needs to understand better what the real science is here -- complicated and I know when I don't understand what I need to -- looking forward to going to Jackson on 14th. Can offer paradigmatic examples that capture essence of what we're trying to teach in an interactive way -- having kids discover this through doing. Couple of examples of this that we can put into Biologica -- good ideas for understanding.
Chad:
Thinking also about scaffolding toward interfaces
Stephen:
Can think about standard forms and UIs and guide our representations and visualizations toward this.
Paul:
Possible -- take red and green things, or anything -- each row represents mouse, each column represents an organism -- break into chromosomes, drag into machine, this drops down to DNA level -- scrolls until it finds marker, examines marker, puts red or green dot -- do this once with a chromosome and you have the idea for students. Or students search for markers and make red and green themselves... Rehearse every representation by having them do it first
Stephen:
Don't have to do it all by hand in general case -- have found that graphing is intuitive with temp probes. Feedback can help them create this as well. Can scaffold line graph that way as well... (Don't assume)
Paul:
If it is sufficiently concrete -- make genetics concrete
Making model connect with real world is the hard part -- not good handle here, but translating this is the crux of the problem
Students unable to answer "what mechanism use to find out whether something is recessive or dominant at molecular level"
Stephen will send IRB document
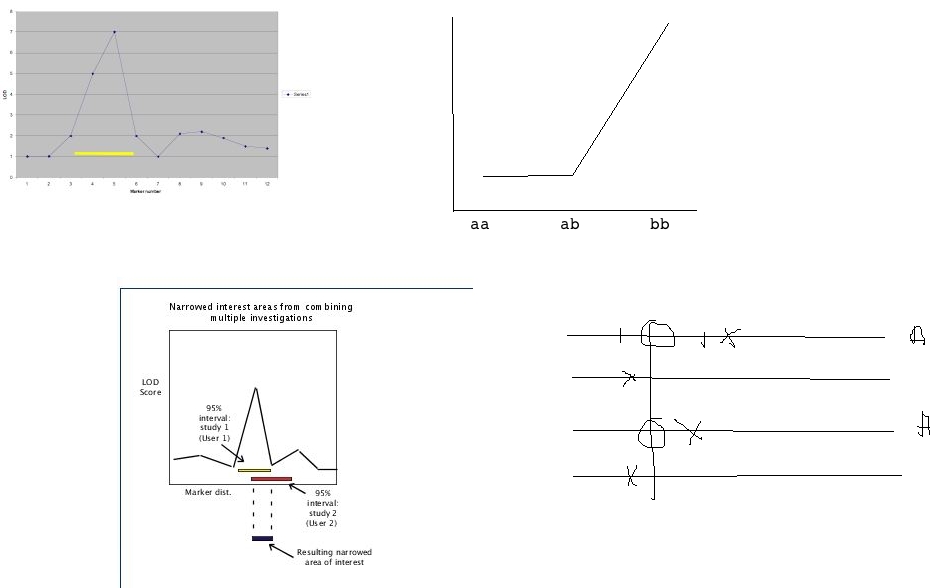
Whiteboard screenshots:
=======================
General examples

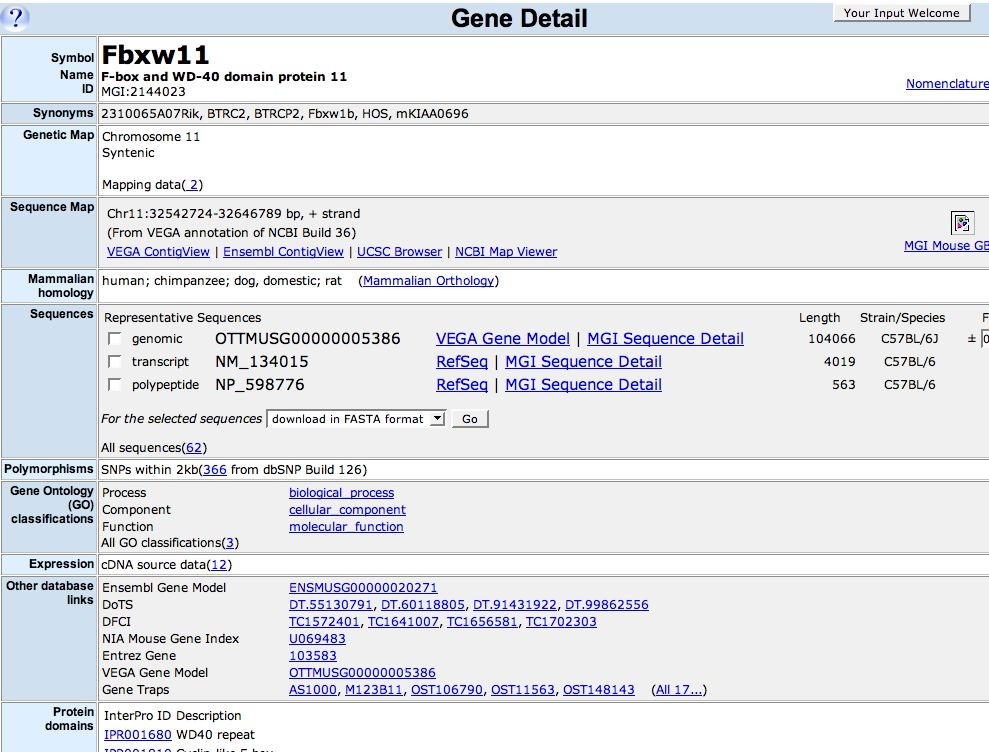
Gene browser drill-down view

Gene Ontology
!Gene Ontology – Molecular Function.jpg!